The first image shows a bullseye plot of global longitudinal strain (GLS) with marked reduction in strain values (less negative numbers) most prominently in the apical segments (central red zone), with an overall GLS of -8.2% (normal is about -20%) and a reduced ejection fraction of 41%. This pattern is characteristic of Takotsubo cardiomyopathy, which typically demonstrates regional wall motion abnormalities that predominantly involve the apex and mid segments of the left ventricle with basal sparing.
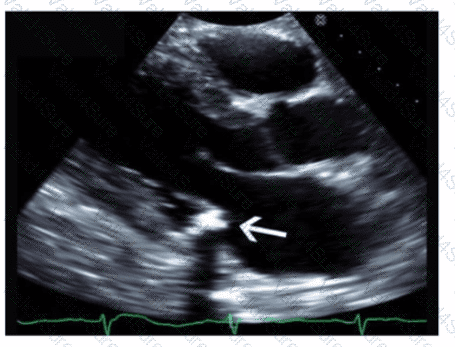
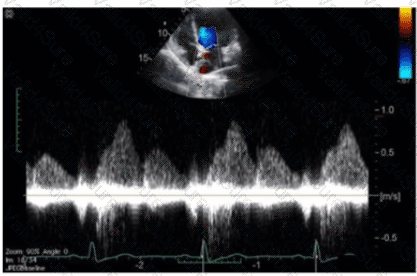
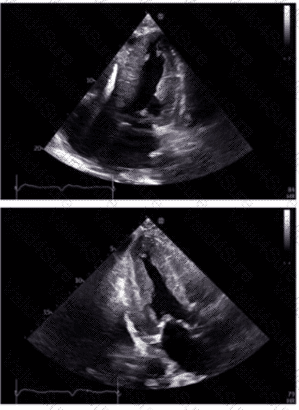
The 2D echocardiographic images show apical ballooning, a hallmark of Takotsubo cardiomyopathy, where the apex is akinetic or dyskinetic and the basal segments contract normally or hypercontract. Doppler images show findings consistent with impaired ventricular function.
In contrast:
Apical hypertrophic cardiomyopathy (HCM) would show increased wall thickness localized to the apex but not apical ballooning or reduced strain in that typical pattern.
Hypertrophic obstructive cardiomyopathy (HOCM) involves basal septal hypertrophy with outflow obstruction, not apical akinesis or ballooning.
Restrictive cardiomyopathy from amyloidosis involves diffuse infiltration and generally a different strain pattern with more uniform reduction and “apical sparing†rather than apical involvement.
This interpretation aligns with the diagnostic criteria and echocardiographic features described in the adult echocardiography literature, including the "Textbook of Clinical Echocardiography" (Chapter on Cardiomyopathies) and ASE guidelines, which highlight apical ballooning and regional strain abnormalities as diagnostic features of Takotsubo cardiomyopathyã€16:Cardiomyopathy Chapter†Textbook of Clinical Echocardiography, 6e】ã€12:ASE Guidelines on Strain Imaging†p.130-135】.