Applied-Probability-and-Statistics Exam Dumps - Applied Probability and Statistics (FZO1 C955)
Searching for workable clues to ace the WGU Applied-Probability-and-Statistics Exam? You’re on the right place! ExamCert has realistic, trusted and authentic exam prep tools to help you achieve your desired credential. ExamCert’s Applied-Probability-and-Statistics PDF Study Guide, Testing Engine and Exam Dumps follow a reliable exam preparation strategy, providing you the most relevant and updated study material that is crafted in an easy to learn format of questions and answers. ExamCert’s study tools aim at simplifying all complex and confusing concepts of the exam and introduce you to the real exam scenario and practice it with the help of its testing engine and real exam dumps
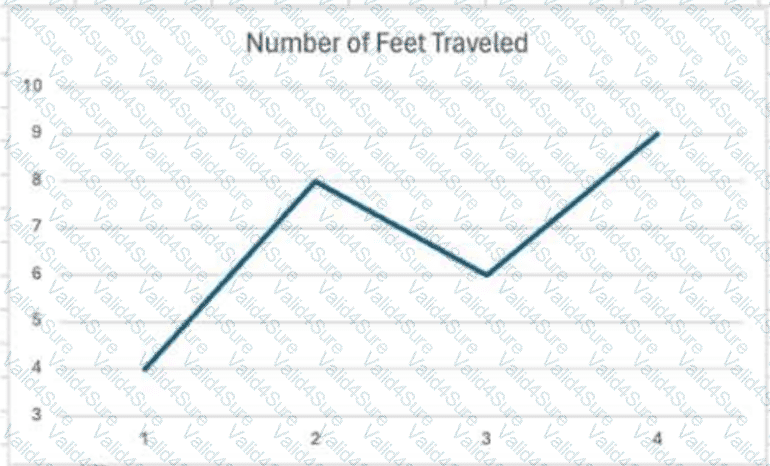
A child’s parents want to analyze the relationship between the daily high temperature and ice cream sales at their child’s ice cream stand. They create the following scatterplot.
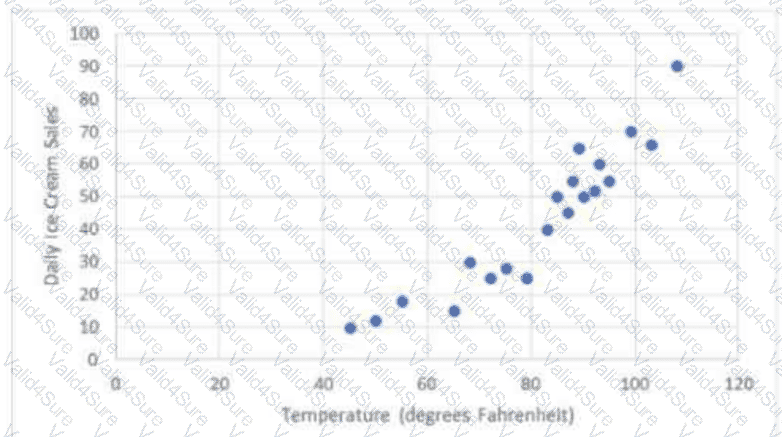
What is the estimated value of r, the correlation coefficient, between these variables?
A road safety research group wants to enhance road safety by analyzing the stopping distance of a car at different speeds. The group has recorded their data in the following scatterplot.
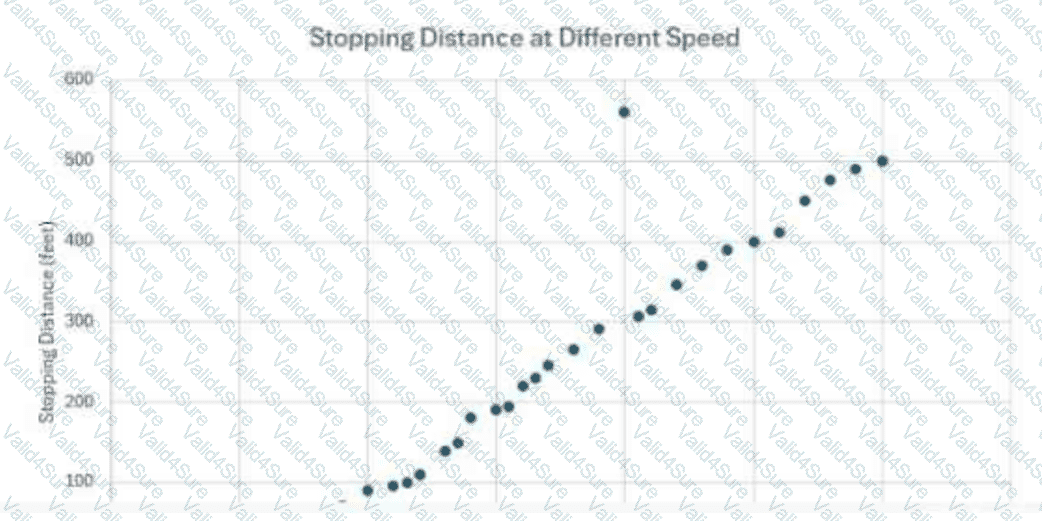
What is true about the outlier in the scatterplot?