Analytics-DA-201 Exam Dumps - Salesforce Certified Tableau Data Analyst
Searching for workable clues to ace the Salesforce Analytics-DA-201 Exam? You’re on the right place! ExamCert has realistic, trusted and authentic exam prep tools to help you achieve your desired credential. ExamCert’s Analytics-DA-201 PDF Study Guide, Testing Engine and Exam Dumps follow a reliable exam preparation strategy, providing you the most relevant and updated study material that is crafted in an easy to learn format of questions and answers. ExamCert’s study tools aim at simplifying all complex and confusing concepts of the exam and introduce you to the real exam scenario and practice it with the help of its testing engine and real exam dumps
You have a dataset that contains sates data. The following is a sample of the data.
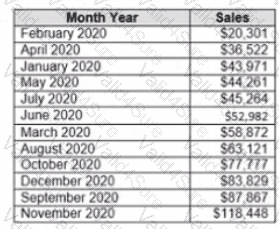
You need to return a value of true if a month has sales greater than $50 000. otherwise the formula must return a value of false.
Which two formulas achieve the goal Choose two
A Data Analyst needs to develop a Sales Dashboard that users can access through a computer or by phone and tablet using the same URL link.
How should the analyst create dashboards that are formatted for specific devices?
A Data Analyst wants to visualize the distribution of employee salaries across a large corporation. The analyst needs to divide the salary range into equal intervals for better analysis and presentation.
What should the analyst create to implement this in Tableau?
You want to add a comment to March 2020 as shown in the following visualization.
You have the following sets in a Tableau workbook
• Top N Customers
• Customers of 2020
• Top N Products
• Sellers of 2020
Which two sets can you combine? Choose two
A Data Analyst plans to create the following dashboard.
When a user clicks the envelope icon, an email addressed to support@example.com must open.
Which type of action should the analyst use?